


Your latest post reached far beyond your usual audience. The impressions look encouraging, but did anyone visit your profile, click through, or become a useful contact? X (Twitter) analytics helps you investigate that gap between visibility and value.
Start with the outcome you wanted. A conversation starter and a product announcement need different evidence of success. Comparing them through one percentage can reward the wrong content.
This guide explains where to find performance data, how to interpret the main metrics, and how to turn a weekly review into a concrete publishing decision. It also shows where Metriwo can add useful context.

Quick summary
- Track trends, not isolated numbers
- Match metrics to campaign goals
- Compare similar posts and periods
- Turn findings into next actions
What is X (Twitter) analytics?
X analytics is the collection and interpretation of account, post, and audience performance data. Metrics describe what happened. Analytics explores possible explanations. Your next action tests whether an explanation is useful.
Suppose a post earns unusually high impressions but attracts few relevant replies. Distribution increased; message relevance may not have followed. Check the opening, audience, and interaction types before repeating the format.
Follower movement adds another perspective. A post can spark discussion among existing followers without attracting new ones. That may suit a community objective perfectly well.
The X (Twitter) Analytics Tool provides another view of account and content performance. Read its available metrics alongside the context from your own X account.
See your X performance in one clear dashboard.
The core rule
Never evaluate an X metric alone. Compare it with the campaign objective, a relevant previous period, and at least one supporting metric. Before celebrating a percentage increase, check the underlying totals and whether the posts had comparable opportunities to perform.
How to check X (Twitter) analytics
Access guidance reviewed September 22, 2026. Navigation and available metrics can vary by account and product surface. Treat the current interface and official Post Activity Dashboard guidance as your references.
How to view analytics on desktop
Sign in to the account you want to measure. Open its available analytics area and select a reporting period. Review the overall trend, then inspect individual posts that contributed to it.
X’s documentation describes access through an ads account or registration at its analytics site. It identifies Analytics, then Post activity, within the ads interface. These documented routes should not be treated as identical navigation for every account.
Record the date range and whether the figures include promoted activity. An advertising burst can change the distribution of a post without proving its organic performance improved.
How to view post analytics on mobile
Open one of your published posts and look for the available analytics or activity control. Use the metrics your account exposes. A visible public view count does not establish that you have access to a complete account dashboard.
For comparisons, let posts accumulate data for similar lengths of time. Comparing a post published this morning with one published last week gives the older post an obvious advantage.
Who should use X analytics?
The useful question depends on who will act on the answer. A creator may need a stronger reason for readers to follow. A marketing leader needs evidence that attention translates into qualified demand.
| Role | Main question | Useful metric |
| Creator | What attracts relevant followers? | Follower growth |
| Social manager | Which posts start useful conversations? | Replies and engagement rate |
| Marketing leader | Does X generate qualified interst? | Clicks and conversions |
| Agency | What should the client change? | Comparable period trends |
| Care team | Which issues keep recurring? | Reply themes |
Customer care teams should read the replies themselves. More responses can mean helpful discussion or an unresolved service problem. Counting them cannot distinguish between those situations.
Agree on the decision before building a report. It makes the review shorter and prevents every stakeholder from requesting another number without explaining how they will use it.
Which X metrics should you track?
Choose a primary metric for the objective and supporting measures that explain it. Distribution, conversation, and website action answer different questions.
X defines engagements broadly, including several kinds of clicks and interactions. Its documented formula is:
Engagement rate = total engagements ÷ impressions × 100
For a hypothetical example, 200 engagements across 10,000 impressions produce a 2% rate. That percentage does not mean 2% of unique people engaged, or that 200 different people took action.
| Metric | What it shows | Decision it supports |
| Impressions | Content distribution | Test topic and timing |
| Engagement rate | Interactions relative to imperssions | Compare similar posts |
| Replies | Conversation response | Refine discussion prompts |
| Reports | Sharing behavior | Repeat useful formats |
| Link clicks | Visit attempted from a post | Improve offers and CTAs |
| Profile visits | Interest in the account | Refine profile positioning |
| Follower growth | Change in audience size | Investingate possible growth drivers |

Interpretation warning
High impressions indicate distribution, not necessarily attention, trust, or conversion. Check the substance of replies, profile activity, and downstream actions before declaring success. If the objective was qualified traffic, a widely viewed post with little relevant website activity still needs investigation.
Read total engagements beside the rate. A high percentage on a very small audience may contribute less useful activity than a lower percentage with broader distribution.
Public view counts can include repeat viewing, so views and unique people are not interchangeable. Keep public views, native impressions, and metrics from another tool distinct unless their definitions match.
Our guide to Social Media Analytics Metrics explains how to group measures around business objectives across networks.
How to get more value from X analytics with Metriwo
A useful workflow connects an observation to a decision. Metriwo’s Social Media Analytics Tool offers account analysis alongside publishing and comparison areas. The following steps distinguish observed public account data from private metrics available only through authorized access.
1. Find the posts worth repeating
In Analysis, choose X, search for a public account, and open its report. The inspected interface includes Recent Posts and sorting controls. Review engagement, visible views, replies, and sharing activity in context.
For your own campaigns, add native impressions and link clicks where available. Those private measures were not visible in the public report inspected for this guide.
A hypothetical post with fewer impressions but more qualified clicks may contribute more to a lead campaign. Compare it with other posts pursuing that objective, rather than a discussion post designed to generate replies.

2. Detect content patterns
Review at least four weeks before treating a result as a repeatable pattern. That is a practical testing window, not a guarantee of sufficient evidence for every account.
- Group posts by subject matter
- Compare openings within similar formats
- Record media and publishing time
- Note each call to action
These categories can be recorded in your own review sheet. Do not assume the dashboard automatically classifies every creative choice.
3. Find better publishing times
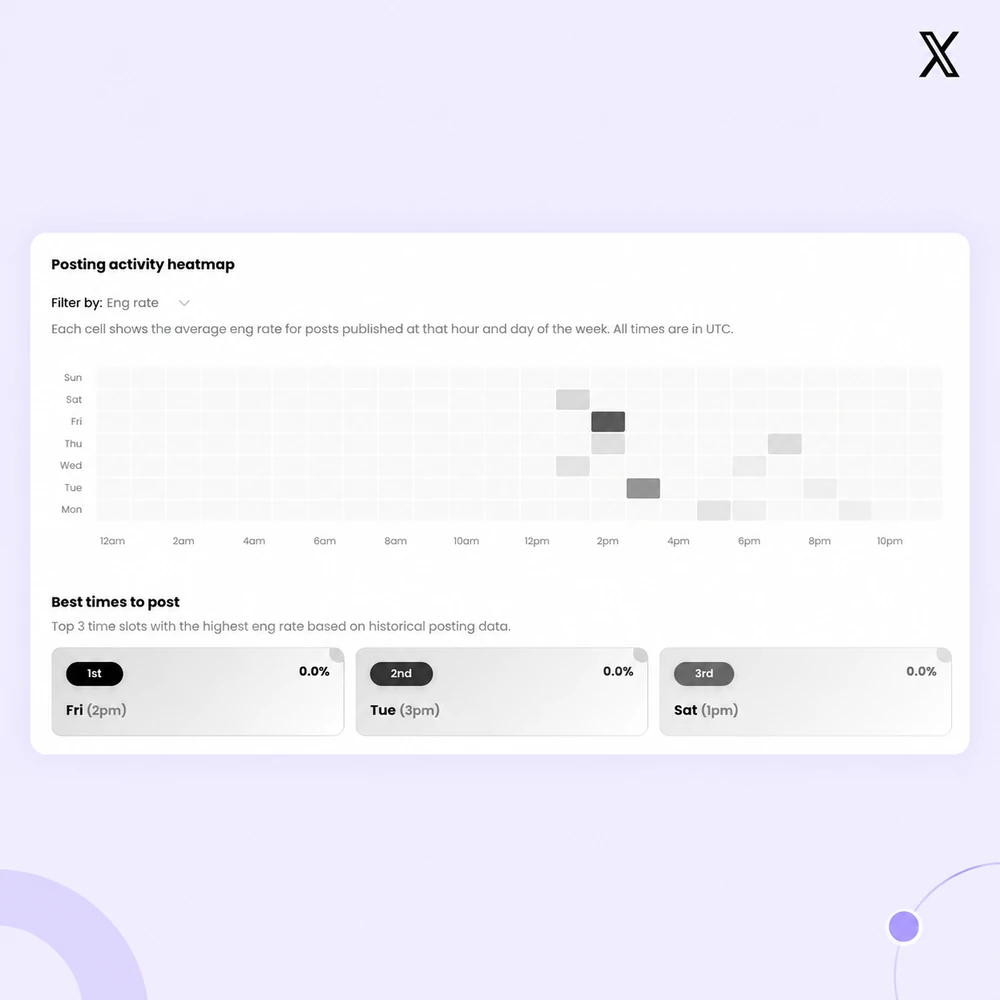
The inspected Posting activity heatmap summarizes historical post performance by weekday and hour in UTC. It is not a direct count of followers currently online.
Compare two publishing windows using similar content. Review the number of posts behind each window before trusting an apparent winner. A strong cell supported by one post gives you a hypothesis, not a reliable schedule.
Keep the content type reasonably constant and review the experiment after four weeks. Convert UTC into the publishing account’s time zone before scheduling.
4. Understand follower and account trends
Read follower changes alongside campaign dates, publishing frequency, and profile activity where available. A single follower total cannot show the direction of growth.
Historical coverage depends on the account and data available. If you only have a current public snapshot, record comparable snapshots over time rather than describing an unavailable growth curve.
A follower increase after a popular post is a reason to investigate. It does not establish that the post caused every new follow.
5. Benchmark against competitors
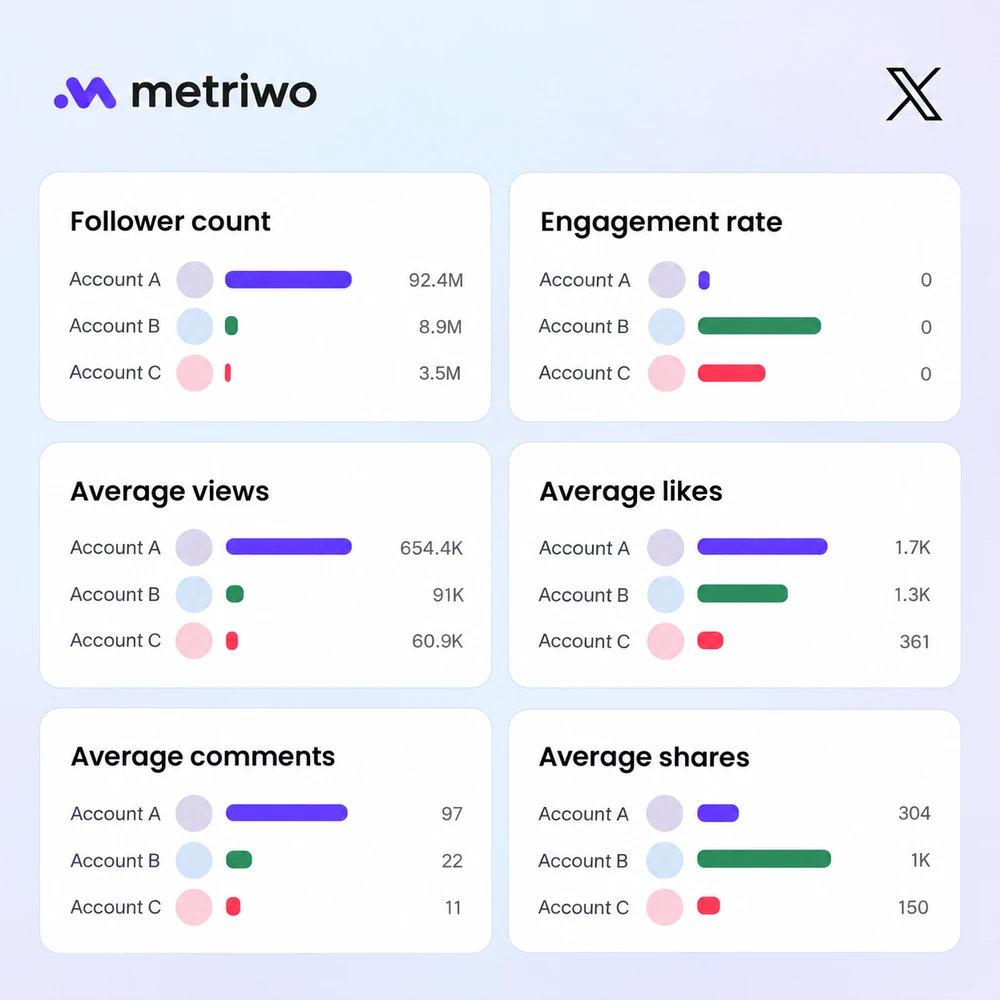
Use the Social Media Competitor Analysis Tool to examine public account patterns. Our guide to social media competitor analysis explains how to choose accounts with similar audiences, categories, and sizes.
Compare posting cadence, visible engagement, and successful formats. Private clicks, conversions, and complete native engagement data should not be inferred from public competitor reports.
Check the denominator before comparing rates across tools. Use Social Media Benchmarking as context for selecting a sensible comparison group.
Compare your X performance with relevant accounts.
6. Turn findings into reports and schedules
Write one finding, its supporting evidence, and the next test before assembling a report. The Social Media Reporting Tool describes Metriwo’s reporting options; verify the options available in your workspace before promising a particular export or delivery method.
Move the chosen test into the X (Twitter) Post Scheduler. Confirm the destination account, publishing time, and post preview. Then measure the result against the original hypothesis.

How X analytics supports business results
Improve content relevance
Read strong and weak posts together. If a practical example attracts detailed replies while a broad announcement attracts only likes, test another specific example before abandoning the topic.
Reposts suggest people found something worth sharing, but the reason matters. Praise, criticism, and useful reference material can all travel. Read the surrounding conversation before turning a post into a campaign template.
Strengthen brand awareness
Impressions show distribution. Profile activity and follower movement can add evidence of discovery. None of these alone measures trust or lasting brand recognition.
Separate paid and organic performance when evaluating changes. Also note unusual mentions, events, or news coverage that may explain a spike beyond your publishing choices.
Connect X activity to outcomes
Use consistently tagged URLs and examine landing page behavior alongside post clicks. A click indicates an attempted visit; it does not prove a session, a qualified lead, or a purchase.
| Pattern | Possible explanation | Next test | Avoid assuming |
| High views, few interactions | Weak relevance | Change opening angle | Visibility equals success |
| Many replies, few clicks | Discussion focus | Clarify the CTA | Replies equal revenue |
| Clicks without conversions | Page mismatch | Align page and promise | All X traffic is poor |
| Follower spike | Increased discovery | Review preceding activity | One post caused it |
| Strong reposts | Shareable value | Repeat the format | Every topic will work |
Treat these explanations as hypotheses. Check the destination page, attribution settings, and conversion definition before changing the content plan. Sometimes the next useful action is fixing a broken form rather than writing another post.
A weekly X analytics workflow
Keep the routine consistent enough that changes become easier to interpret. Use a social media scheduler to organize the next test alongside your broader content plan.
1- Confirm the week’s objective. Choose the outcome and its primary measure before reviewing the largest numbers.
2- Compare results with last week. Use equal periods and note paid activity, events, or missing data.
3- Review the strongest three posts. Look for shared creative choices, not just a familiar topic.
4- Review the weakest three posts. Check timing, clarity, and how long each post has been live.
5- Record one testable hypothesis. State what will change and which result would support the idea.
6- Schedule the next content test. Assign an owner and a date for reviewing the outcome.
Weekly action rule
Every analytics review should produce one documented decision: repeat something, stop something, or test something. Record the evidence and a review date. If the review changes nothing in the next content plan, the team is collecting data without using it to guide the work.
Conclusion
Useful X (Twitter) analytics ends with a decision you can test. Keep the objective, comparison period, and metric definition visible so the next review can evaluate what changed.
Metriwo’s Social Media Management Tool connects analytics, competitor context, and publishing areas in one workspace. Use the capabilities and data available to your account, document one clear finding, and give the next post a specific job.
Analyze your X performance with Metriwo.