
Suppose your latest video gets five times its usual views. TikTok analytics can help you investigate whether people stayed, shared it, found it through search, or became interested in your account.
Start with the job that video was meant to do. A product demonstration and a community joke need different evidence of success. Review discovery, viewing behavior, and the next action together before changing your content plan.
Quick summary
- Track patterns, not viral exceptions
- Compare videos with similar goals
- Treat retention as a diagnostic
- Turn insights into content tests
What are TikTok analytics?
TikTok analytics describes account, content, viewer, and follower performance. Metrics show what happened; analysis explores possible reasons; testing checks whether a proposed explanation holds up.
Our social media analytics guide explains how to connect these different signals to a business objective. For TikTok, begin with the question your next content decision needs to answer.
Why TikTok analytics matter
A practical review helps decide whether to repeat a topic, tighten an opening, or change the promise on your profile.
Analytics principle
A dashboard cannot establish exactly why a video succeeded. It can reveal a pattern worth testing. Record a possible explanation, change one relevant element, and check whether comparable videos produce a similar result before treating the pattern as a reliable rule.
How to access TikTok analytics
On the TikTok mobile app
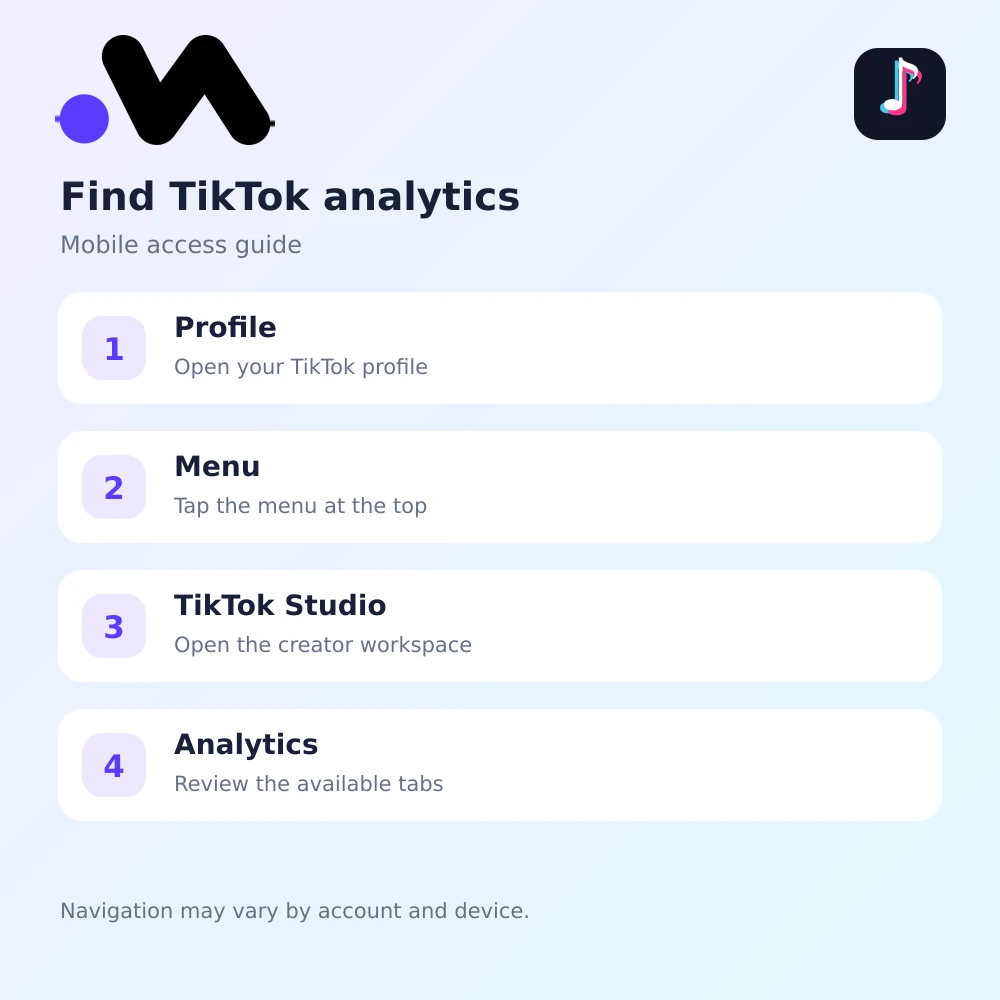
TikTok’s current creator tools guidance directs users through their profile menu to TikTok Studio.
- Open your profile in TikTok.
- Tap the menu at the top.
- Select TikTok Studio from the menu.
- Open Analytics and review available tabs.
Business accounts may also have a Business Suite route.
On desktop
Open TikTok Studio in your browser and sign in. Choose Analytics from the available navigation, then inspect account, content, or follower information.
The TikTok Studio documentation describes Overview, Content, Viewers, and Followers. Browser and app experiences can differ; eligibility, region, device, and rollout also affect availability.
A Business Account is not universally required. TikTok lists analytics among Personal Account features, too.
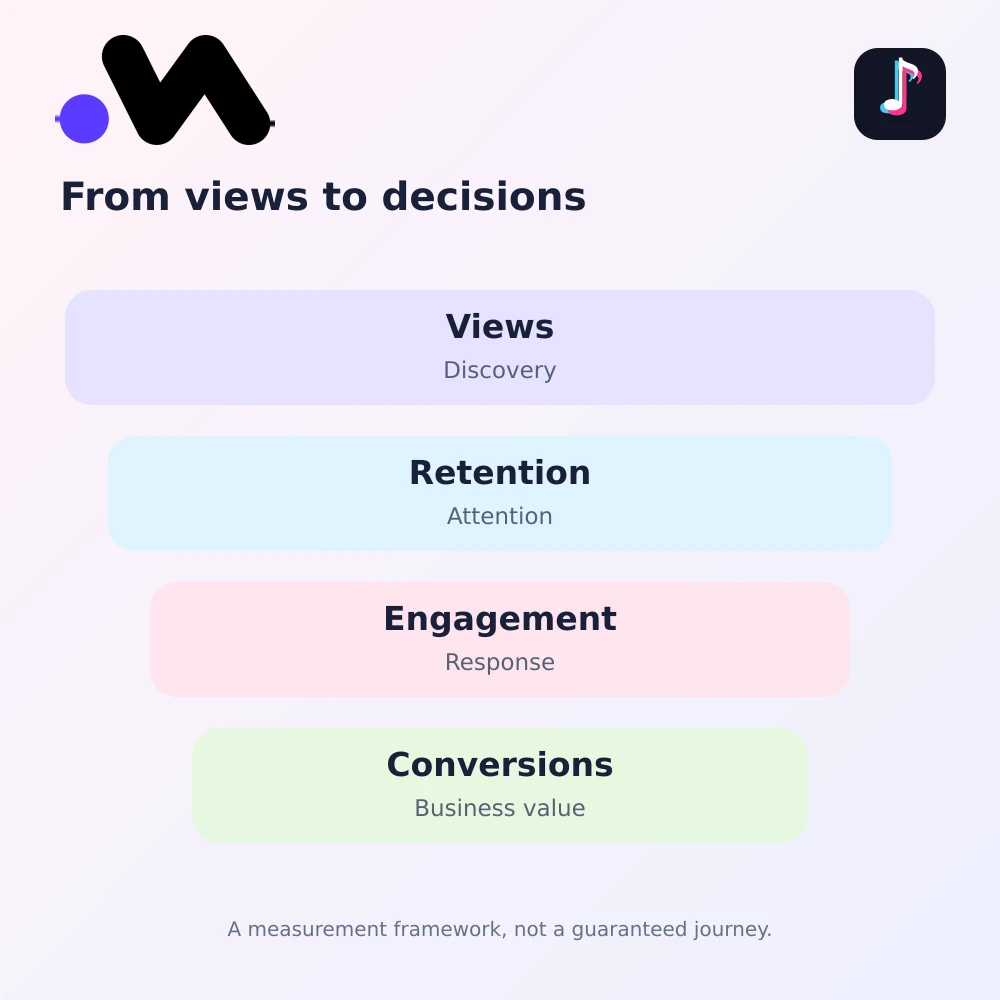
Key TikTok analytics metrics to track
Use native analytics for private viewing and audience data, and distinguish those fields from public account statistics.
| Category | Metrics | Main question |
| Discovery | Views, traffic sources | How was content found? |
| Retention | Watch time, completion | Did viewers keep watching? |
| Engagement | Likes, comments, shares | Did viewers respond? |
| Growth | Net followers, profile views | Did interest continue? |
| Audience | Location, activity times | Who is watching? |
| Conversion | Visits, leads, revenue | Did attention create value? |
Reach and discovery
Video views count viewing activity, not necessarily unique or attentive viewers. Use unique viewer figures separately when available. Profile views indicate interest in the account, rather than a commitment to follow.
Traffic sources can distinguish discovery through For You, Following, profiles, search, and other available surfaces. Search queries, where exposed, help you check whether the video answers the question that brought people there.
Retention
Total play time describes accumulated viewing. Average watch time describes average viewing duration. Completion and retention data add context about reaching the end and where attention drops.
A slow introduction, repetitive middle, or unclear payoff may be worth revising. Compare similar lengths and formats before blaming the topic. Watch time is a diagnostic, not a guaranteed ranking switch.
Engagement
Read likes, comments, shares, and saves together. A saved tutorial may serve a different need from a widely shared joke. Read comments to distinguish useful discussion from confusion or criticism.
For your own reporting, label the calculation explicitly:
Engagement rate by views = total engagements ÷ video views × 100
Define which actions you include, such as likes, comments, shares, and saves. Keep that numerator consistent. A tool using followers as its denominator will produce a different rate.
Audience and growth
Review total followers, net follower change, available demographics, locations, and activity times. Viewer and follower populations are different, so do not assume a video reached the same people who already follow you.
| Metric | What it suggests | Possible next test |
| Average watch time | Attention duration | Shorten the setup |
| Completion | Viewing through the ending | Tighten the edit |
| Shares | Shareable value | Repeat the useful format |
| Saves | Reference value | Create a related guide |
| Profile views | Account curiosity | Clarify profile positioning |
| Follower growth | Continued interest | Build a related series |
| Search traffic | Query relevance | Refine searchable wording |
See your TikTok performance in one clear view.
How to interpret TikTok analytics correctly
Combine the signal with an alternative explanation before choosing an action.
High views with weak watch time make the opening and audience fit worth checking. Strong watch time with few profile visits suggests testing a clearer series concept or invitation to explore more.
If profile visits increase without follower growth, inspect the bio, pinned videos, and consistency of the account’s promise.
| Performance pattern | Possible meaning | Next action | Do not assume |
| High views, weak retention | Limited sustained interest | Reveal value earlier | Views equal success |
| Strong retention,few shares | Interesting, less transferable | Add practical value | Retention guarantees growth |
| Many profile visits | Account curiosity | Clarify the profile promise | Visits become followers |
| High saves, few likes | Reference value | Build a related series | Likes capture all value |
| Follower spike | Increased discovery | Review preceding activity | One video caused everything |
| Strong search traffic | Relevant search topic | Test adjacent questions | Every related topic works |
Retention warning
Read watch time relative to video length, format, and objective. Ten seconds represents very different proportions of a twelve second clip and a forty second tutorial. Neither figure alone establishes success. Check completion, the retention curve, and the intended next action.
What TikTok analytics reveals about distribution
Analytics provides clues about discovery without exposing the complete recommendation system. TikTok describes several influences in its recommendation guidance, including viewing behavior and other interactions.
A rise in search traffic may suggest a stronger match with a specific question. More shares can suggest transferable value. Neither establishes a universal formula for reach.
Compare similar videos, note changes in traffic sources, and separate organic results from paid promotion. Otherwise, a distribution change may be mistaken for a creative improvement.
How to find your best time to post on TikTok
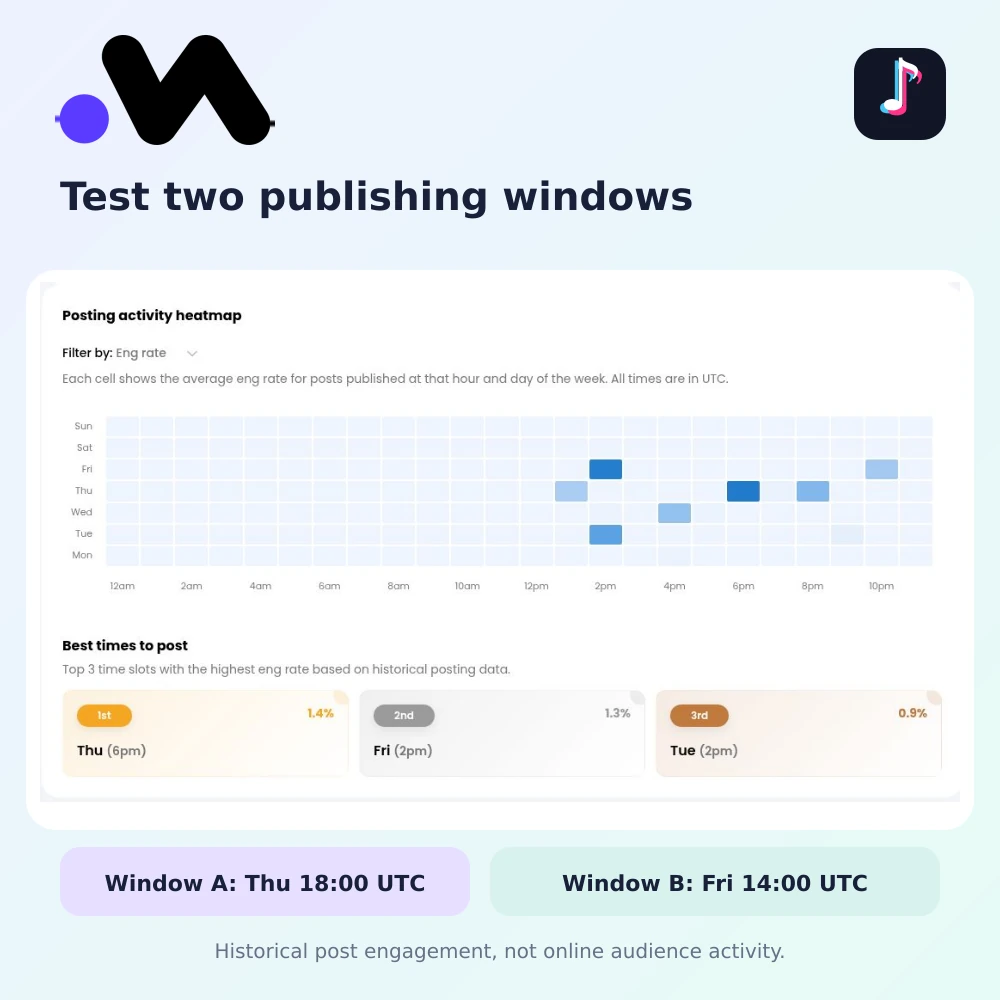
Treat universal timing studies as starting hypotheses. Your best time to post on TikTok depends on audience locations, time zones, available activity data, and historical results.
Run a practical four week test:
- Choose two realistic posting windows.
- Use videos with comparable formats.
- Keep topics and objectives reasonably similar.
- Compare early and later performance.
- Record results and publishing conditions.
Posting shortly before an activity peak is one option to test, not an established advantage.
Distinguish audience activity from a posting heatmap. Metriwo’s inspected heatmap summarizes historical engagement for posts published at each time, in UTC. It does not show how many followers are online.
How to use TikTok analytics with Metriwo
1. Compare videos in one performance view
Open Analysis, select TikTok, and search for a public account. The tiktok analytics tool brings the available account and post metrics into a report.
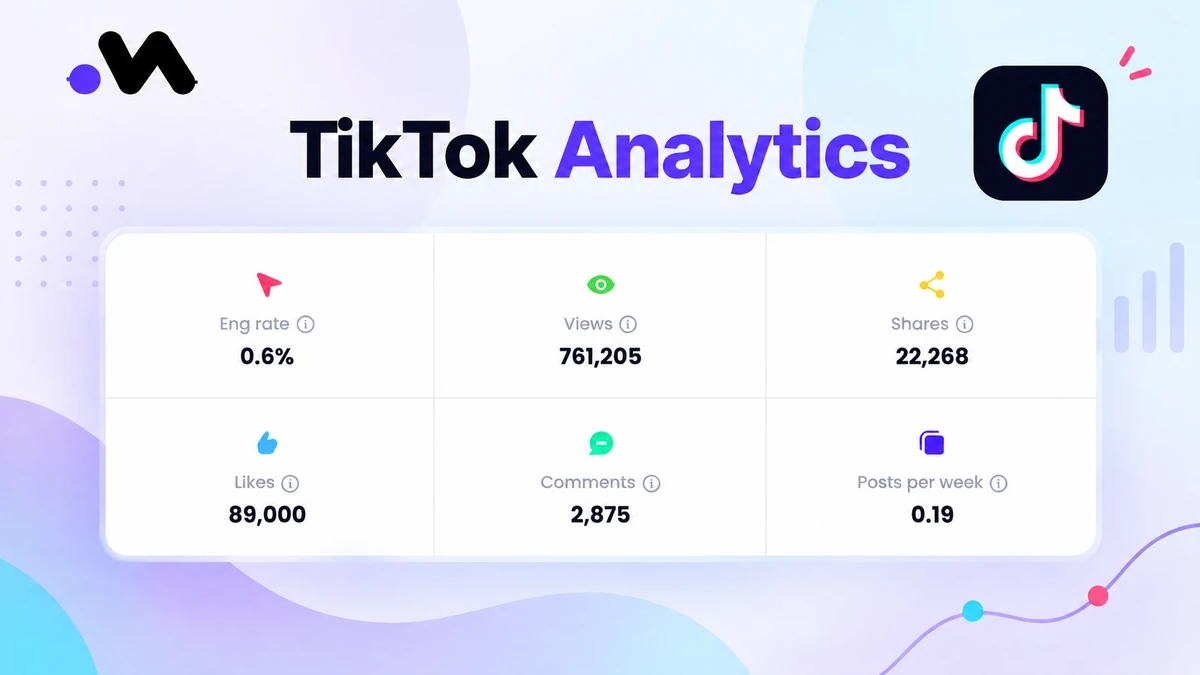
The inspected report showed views, likes, comments, shares, engagement rate, and posting frequency. Compare videos pursuing similar goals. Add watch time, saves, and private follower attribution from native analytics where available; those fields were not visible in this public report.

2. Find repeatable content patterns
Review the videos behind a strong result. Record topic, format, length, opening style, posting time, and hashtag set in a simple review sheet.
Look for repeated evidence before assigning the next content batch to one format.
3. Track audience and follower changes
Use native audience data to refine language, locations, and publishing windows.
Compare equivalent snapshots when historical data is unavailable.
4. Evaluate hashtags in context
The inspected report includes Most Used Hashtags with a metric filter. Use this to investigate the posts associated with a hashtag, alongside their subject and creative approach.
A strong video carrying a tag does not prove that tag caused its reach. Compare repeated use, relevance, and native traffic sources before changing your hashtag plan.
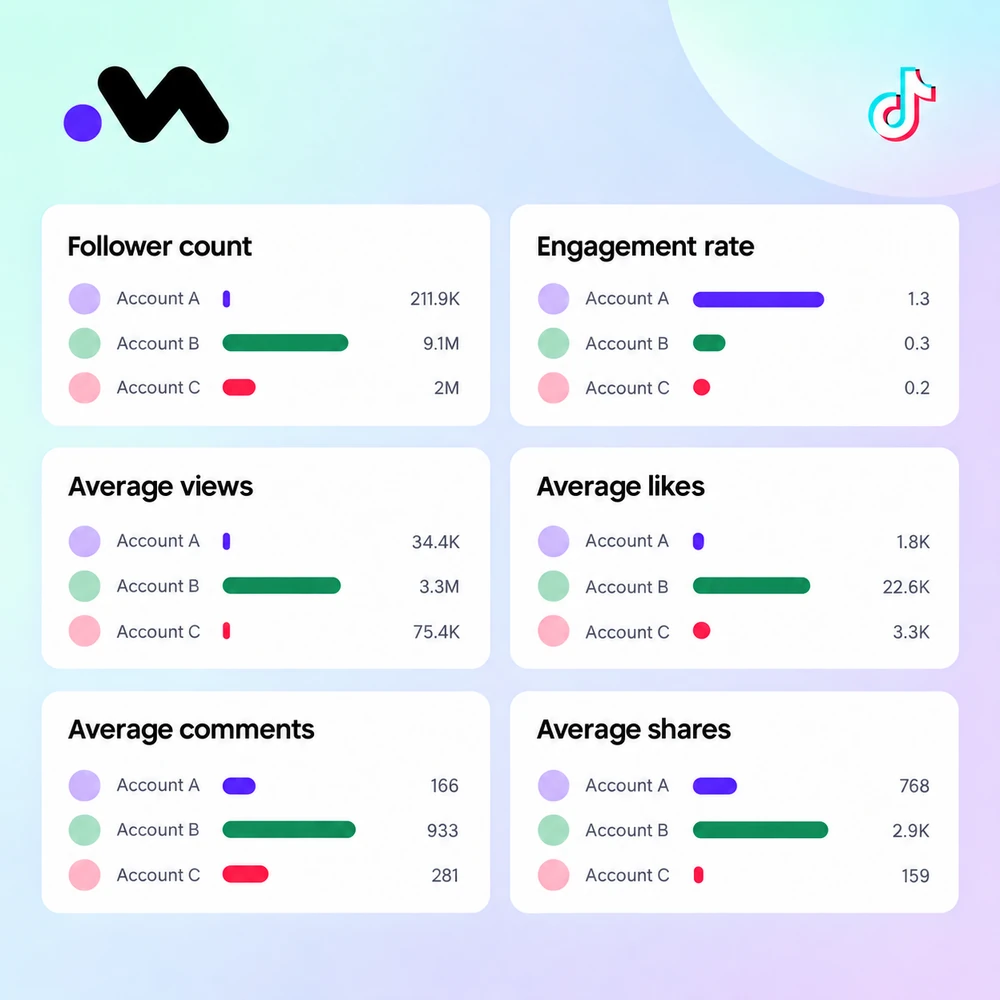
5. Add competitive context
The Comparison area lets you select public TikTok accounts and review available metrics together. Choose similar audiences, markets, and account sizes before drawing a competitive conclusion.
Look for recurring themes and content gaps. Private retention or conversion data cannot be inferred from another account’s public totals. Borrow a useful question, not someone else’s video.
Find the patterns behind your strongest TikTok videos.
6. Connect TikTok with other channels
Use the Social Media Analytics Tool as the broader starting point for your channel review. Check which networks and fields are available in your workspace.
Align objectives and reporting periods before comparing TikTok with other channels. Avoid adding incompatible view counts or treating differently calculated engagement rates as equivalent.

How to use TikTok analytics to measure ROI
Social media ROI begins with a defined outcome. For awareness, evaluate relevant distribution, profile interest, and audience growth. For consideration, investigate saves, shares, useful comments, and website visits.
For conversion, connect activity to leads, sales, revenue, and acquisition costs. Use tagged URLs, website analytics, ecommerce records, and available platform conversion data. Document your attribution window and avoid counting the same sale twice.
Return on ad spend compares attributed revenue with advertising spend. A broader ROI calculation also needs relevant costs and a clearly defined financial return. Do not call a rise in engagement financial ROI.
Organic TikTok can introduce someone to a brand before they return through another channel. That is a reason to examine the journey, not permission to credit TikTok with every assisted sale.
A weekly TikTok analytics workflow
- Confirm the week’s content objective.
- Compare the previous seven days.
- Review the three strongest videos.
- Review the three weakest videos.
- Write one specific performance hypothesis.
- Plan one controlled content test.
Define strongest and weakest by purpose. Distribution matters for awareness; retention helps evaluate education; relevant comments support community goals; downstream actions matter for conversion. Compare videos after similar amounts of time have elapsed.
Action rule
End every review with one documented decision: repeat a format, revise an element, or stop an ineffective approach. Assign an owner and a review date. Keep the evidence beside the decision so the next report can evaluate the test instead of restarting the discussion.
Conclusion
TikTok analytics becomes useful when it changes what your team creates, tests, or stops doing. Keep the objective, data source, and comparison conditions visible. Then give the next video a specific hypothesis to test.
Analyze your TikTok performance with Metriwo.