Blog

  • Social Media Benchmarks 2026: What Good Looks Like by Platform

    Social Media Benchmarks 2026: What Good Looks Like by Platform

    Social media engagement rate benchmarks 2026 — TikTok 3.70%, LinkedIn 2.94%, Instagram 0.48% by platform

    A 0.5% engagement rate on Instagram. Is that good or bad?

    The honest answer: it depends. In fact, it depends on your industry, your follower count, your content format, and which platform you’re measuring. Most social media managers, however, benchmark their performance against a single number — ‘the average’ — and draw the wrong conclusions.

    This guide cuts through the confusion. Below are the 2026 social media benchmarks across TikTok, Instagram, LinkedIn, X, and Facebook — broken down by platform, industry, and what actually drives performance this year. More importantly, we’ll show you how to use these benchmarks to measure your competitors, not just yourself.

    Data source:  All benchmarks in this guide are sourced from Socialinsider’s 2026 report (70M+ posts analyzed), supplemented by Rival IQ, Buffer (52M posts), and SociaVault Labs (350K+ accounts). Where sources conflict, we use the most conservative estimate.

    The 2026 Benchmarks at a Glance

    First, the headline numbers. These are average engagement rates across all industries and account sizes for each platform in 2026:
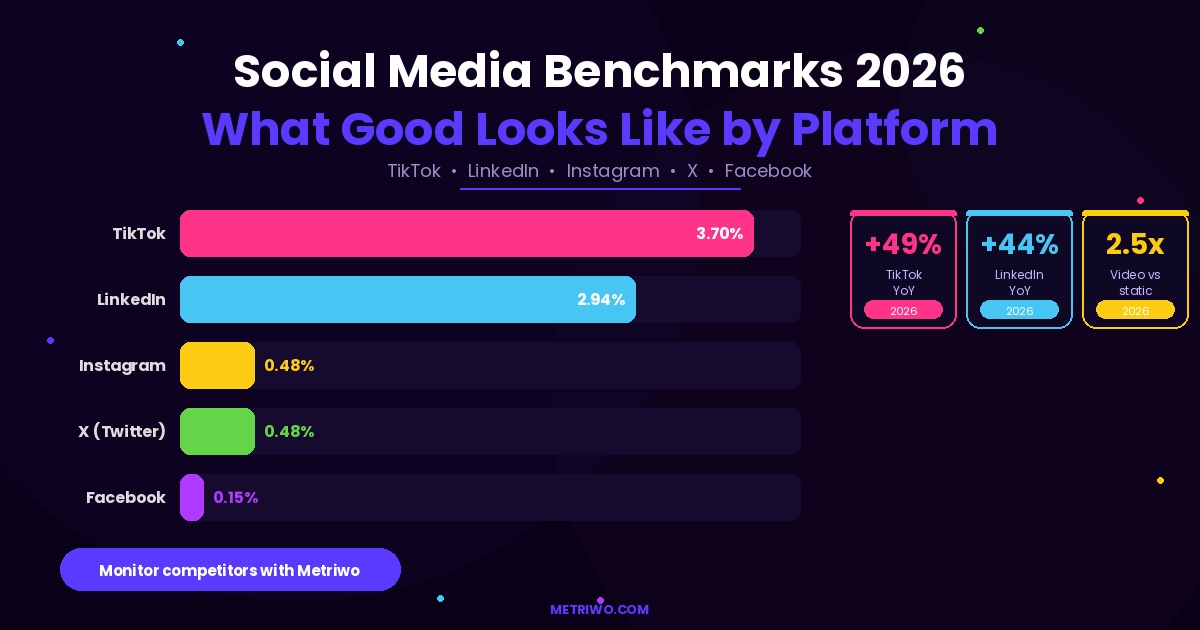
    PlatformAvg Engagement RateYoY ChangeBest Content FormatBest For
    TikTok3.70%+49% YoYShort video (15-30 sec)B2C, Entertainment, Education
    LinkedIn2.94%+44% YoYDocument posts, PollsB2B SaaS, Technology
    Instagram0.48%FlatReels (+44% vs static)Visual brands, E-commerce
    X (Twitter)0.48%StableReal-time text postsNews, Tech, Thought leaders
    Facebook0.15%DecliningVideo, Local contentLocal business, 35-54 age

    Consequently, the single biggest story of 2026 is that TikTok is pulling further ahead. Its 3.70% average engagement rate is 7.7x higher than Instagram and 24.7x higher than Facebook. Meanwhile, LinkedIn quietly became the fastest-growing platform for engagement, up 44% year-over-year — a trend most brands haven’t caught up with yet.

    Key insight:  Video wins across every platform in 2026. Short-form video generates 2.5x more engagement than static content. Instagram Reels deliver 44% higher engagement than feed posts. If you’re not posting video, you’re working against the algorithm on every platform.

    Why ‘Average’ Benchmarks Are Misleading

    Before you compare your numbers to the table above, however, there are two variables that matter more than the platform average:

    1. Your follower count changes everything

    Engagement rate has an inverse relationship with audience size on every platform. The larger your following, the lower your expected engagement rate. For example, a 2% Instagram engagement rate is mediocre for a 5,000-follower account — and exceptional for a 500,000-follower account.

    Always benchmark against accounts in the same follower tier, not against the platform-wide average.

    2. Your industry sets the baseline

    A 0.84% Instagram engagement rate sounds weak — until you realize that’s the benchmark for B2B SaaS. For that industry, 0.84% is exactly average. Compare yourself to your vertical, not the overall number.

    IndustryTikTok ERInstagram ERLinkedIn ERBest Platform
    B2B SaaS3.0%0.84%2.80%LinkedIn
    E-commerce4.5%1.45%1.67%TikTok
    Education7.36%2.10%1.85%TikTok
    Media/Entertainment5.2%1.29%1.57%TikTok
    Healthcare3.4%1.21%1.81%LinkedIn (B2B)
    Financial Services1.9%0.67%1.75%LinkedIn
    Food & Beverage4.9%1.40%1.48%TikTok
    Technology/Software3.7%0.84%1.95%LinkedIn / X

    The education vertical is an outlier worth noting. At 7.36% on TikTok, educational content gets nearly 2x the platform average. The TikTok algorithm specifically favors informational content — if your brand has anything educational to share, TikTok should be a priority.

    2026 engagement rate benchmarks by platform — TikTok, LinkedIn, Instagram, X, Facebook comparison

    Platform-by-Platform Breakdown

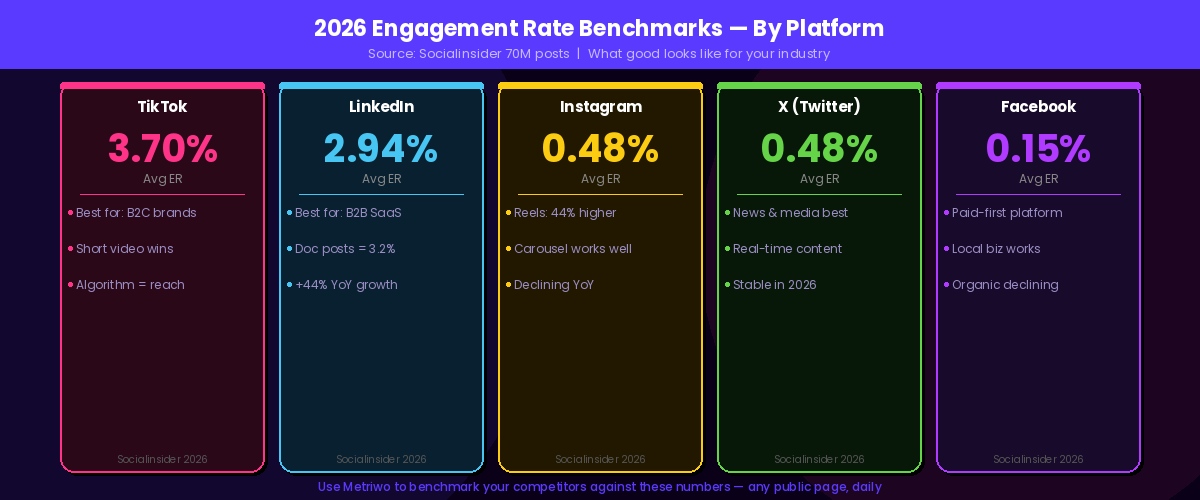
    TikTok — 3.70% average engagement rate

    TikTok remains the highest-engagement platform by a significant margin. Its ‘For You’ algorithm distributes content based on interest signals rather than follower count, which means new accounts get a genuine shot at reach that’s simply not available on other platforms.

    What works in 2026: Duets and Stitches generate the highest engagement (5.1%), followed by trending sounds (4.6%) and text-on-screen explainers (4.2%). Videos under 30 seconds consistently outperform longer content.

    Who should prioritize TikTok: B2C brands, education, entertainment, food and beverage, and e-commerce. B2B brands see lower TikTok ER (3.0% for SaaS) but can still use it effectively for brand awareness and founder-led content.

    Benchmark to beat: If your TikTok ER is above 3.70%, you’re above average. Above 5%, you’re in the top quartile.

    LinkedIn — 2.94% average engagement rate

    LinkedIn is the benchmark story of 2026. Up 44% year-over-year, it’s now the fastest-growing engagement platform — and most B2B brands haven’t fully capitalized on it yet.

    What works in 2026: Document posts (PDFs) generate the highest engagement at 3.2% — 73% above baseline. Polls follow at 2.8%. Text-only founder posts consistently outperform image posts, as LinkedIn’s algorithm rewards authentic personal voice.

    Who should prioritize LinkedIn: B2B SaaS (2.8% ER), technology, manufacturing, professional services. If you’re selling to business decision-makers, LinkedIn should be your primary organic channel.

    Benchmark to beat: For B2B SaaS, 2.8% is your average. Above 4.5% puts you in the top quartile for your vertical.

    Instagram — 0.48% average engagement rate

    Meanwhile, Instagram’s engagement rate has stayed nearly flat in 2026, continuing a multi-year decline from its peak. The platform’s algorithm heavily favors Reels, which deliver 44% higher engagement than static feed posts.

    What works in 2026: Reels first, carousels second. Static posts should be used sparingly — they reach 18-28% of followers for smaller accounts, down from 40-50% in 2024.

    Who should prioritize Instagram: E-commerce (1.45% ER), food and beverage (1.40%), education (2.10%), and any brand with strong visual content.

    Benchmark to beat: 0.48% is the platform average. For most B2C brands, 1%+ is a realistic target. For B2B, 0.5-0.8% is solid performance.

    X (Twitter) — 0.48% average engagement rate

    In contrast, X has stabilized at 0.48% after several years of decline. Real-time content and text-first posts remain the strongest formats. The news and media sector sees the highest engagement at 0.67%, while retail averages 0.39%.

    Who should prioritize X: Tech brands, developer tools, media, and any brand that benefits from real-time commentary and thought leadership. Less suited for visual B2C brands.

    Facebook — 0.15% average engagement rate

    Facebook’s organic engagement continues to decline. For most B2B brands (SaaS, technology), Facebook is now effectively a paid-only channel — organic posts generate 0.28-0.32% engagement, making it the lowest-ROI platform for organic content.

    Who still gets value from Facebook: Local businesses, real estate (4.64% ER — the highest on Facebook), nonprofits, and brands targeting the 35-54 age demographic. Facebook Groups also drive higher engagement than business pages.

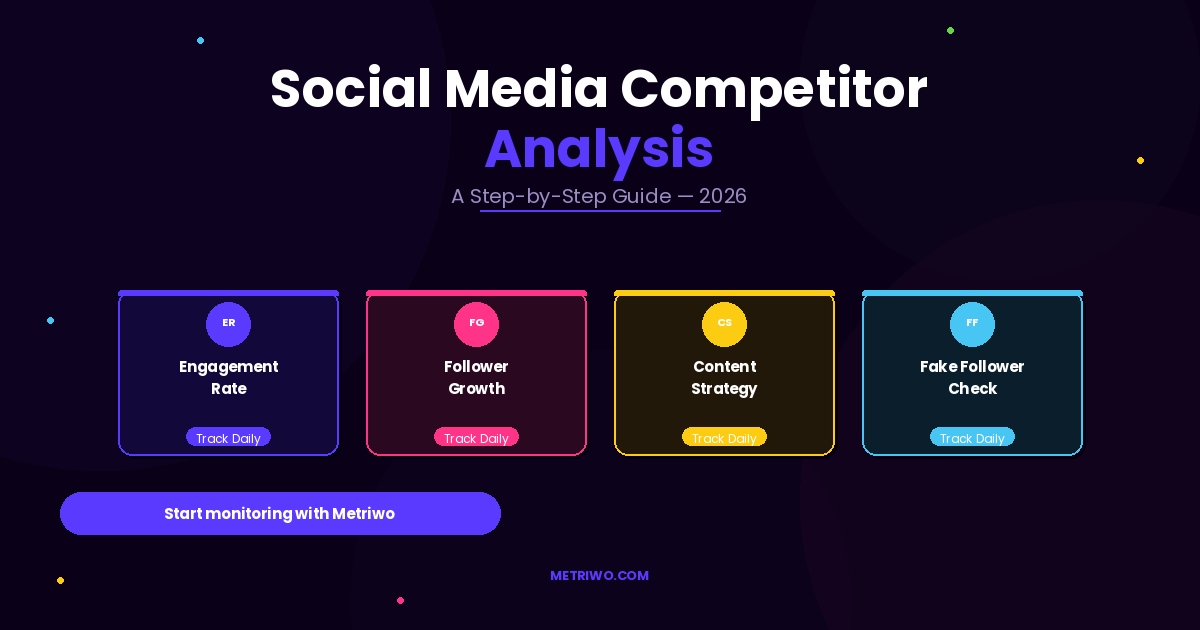
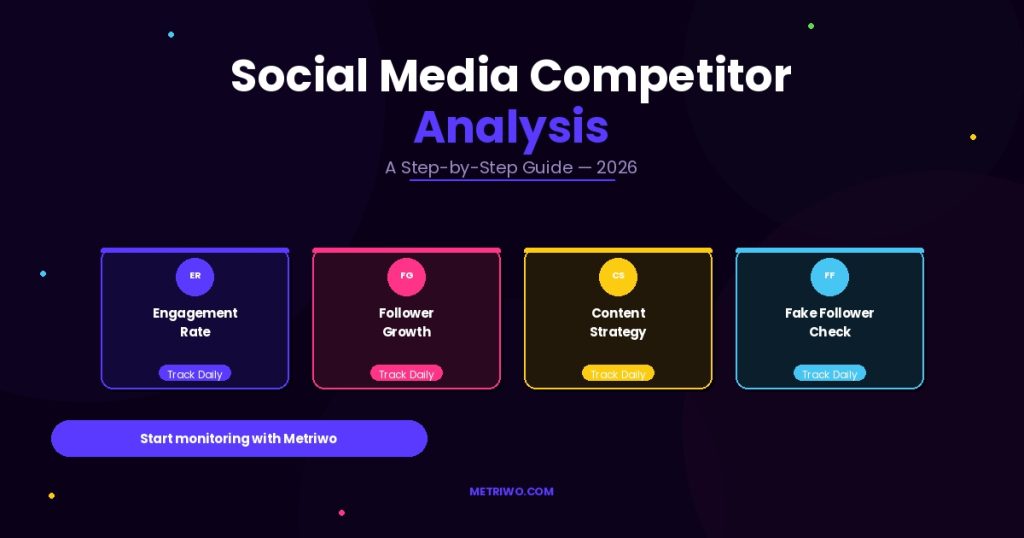
    How to Use Benchmarks to Analyze Your Competitors

    Nevertheless, knowing the platform benchmarks is only half the picture. The more valuable comparison is against your direct competitors — because industry averages hide the gap between you and the brands actually competing for your audience.

    Here’s how to build a competitor benchmark analysis:

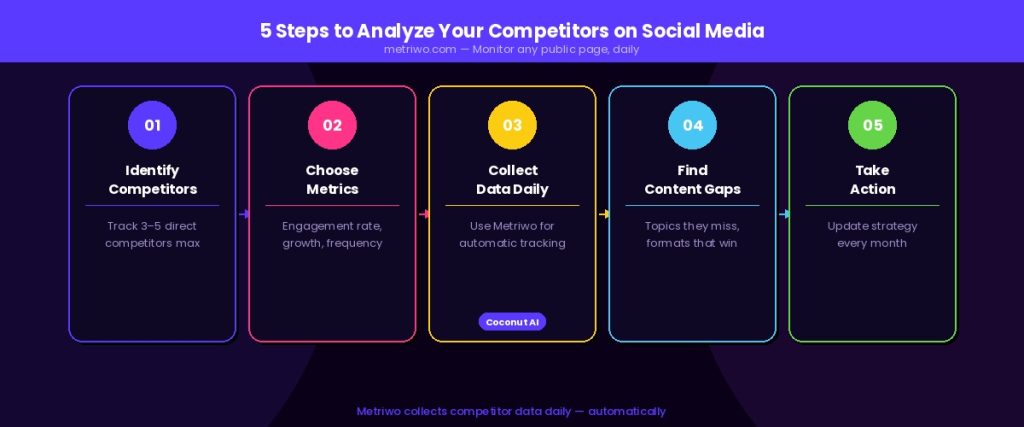
    1. Pick 3-5 direct competitors. Not aspirational brands — actual competitors targeting the same audience.
    2. Track the same metrics across all of them. Engagement rate, follower growth rate, posting frequency, and top-performing content format. Compare apples to apples.
    3. Look for outliers. If one competitor is consistently 2x above the others on TikTok, study their content. What format? What topics? What posting frequency?
    4. Check their follower quality. A competitor with strong engagement metrics but 30% fake followers has a smaller real audience than it looks. Fake follower analysis changes how you interpret competitor benchmarks.
    5. Monitor changes over time. A single snapshot isn’t enough. What matters is whether a competitor’s engagement is growing or declining — and how fast.
    Metriwo note:  Metriwo monitors any public Instagram, Facebook, X, LinkedIn, or TikTok account daily — without needing access to that account. Coconut, Metriwo’s AI assistant, surfaces the most significant changes automatically so you know when a competitor is outperforming the benchmark before it becomes a trend.

    What a ‘Good’ Engagement Rate Actually Means in 2026

    The most common mistake: comparing your engagement rate to the platform average without accounting for your follower tier and industry.

    Here’s a practical framework:

    • You’re underperforming if you’re more than 30% below your industry benchmark consistently for 3+ months. Look at content format, posting frequency, and audience quality.
    • You’re performing average if you’re within 20% of your industry benchmark. Focus on incremental improvements — better hooks, more consistent posting, more Reels.
    • You’re outperforming if you’re 30%+ above your industry benchmark. Document what’s working and double down before competitors catch up.
    • You’re in the top quartile if you’re consistently 50%+ above your industry benchmark. At this point, benchmark against your direct competitors, not the industry average.

    One final note: benchmarks are averages, not targets. The goal isn’t to hit 3.70% on TikTok — it’s to outperform your specific competitors for your specific audience. Use industry benchmarks to calibrate expectations, and competitor benchmarks to drive strategy.

    See how your competitors measure up against these benchmarks. Metriwo tracks engagement rate, follower growth, and posting frequency for any public social media account — daily. No access needed. Coconut AI highlights when a competitor is pulling ahead. metriwo.com  →

    Frequently Asked Questions

    What is a good engagement rate on Instagram in 2026?

    The average Instagram engagement rate in 2026 is 0.48% across all industries. For B2C brands, 1%+ is a realistic target. For B2B SaaS, 0.5-0.8% is solid performance. Reels consistently outperform static posts by 44%, so content format matters as much as the number itself.

    What is a good engagement rate on TikTok in 2026?

    The average TikTok engagement rate in 2026 is 3.70%, up 49% year-over-year. Above 3.70% means you’re performing above average. Above 5% puts you in the top quartile. Education content sees the highest TikTok engagement at 7.36% — nearly twice the platform average.

    Which social media platform has the highest engagement rate in 2026?

    TikTok has the highest average engagement rate at 3.70%, followed by LinkedIn at 2.94%. Instagram averages 0.48%, X averages 0.48%, and Facebook averages 0.15%. For B2B brands specifically, LinkedIn is the highest-engagement platform and grew 44% year-over-year.

    How do I benchmark my social media performance against competitors?

    Track 3-5 direct competitors’ engagement rate, follower growth, and posting frequency over time. Compare these metrics against your own numbers and against industry benchmarks. Tools like Metriwo monitor any public social media account daily — no access required — and surface changes automatically.

    Why is my engagement rate declining even though I’m posting more?

    Posting more can actually hurt engagement rate if content quality drops. In 2026, algorithms on every platform reward watch time and saves over reach. Other common causes: audience composition has shifted (too many fake or inactive followers), content format is misaligned with what the algorithm favors, or posting at wrong times for your specific audience.

    The Bottom Line

    The 2026 benchmark numbers tell a clear story: TikTok and LinkedIn are growing, Instagram is holding steady, and Facebook is in structural decline for organic content. Video wins everywhere.

    However, platform averages are a starting point, not a destination. The brands that consistently outperform aren’t chasing the industry average — they’re tracking their specific competitors, identifying what’s working in their niche, and adapting before the trends become obvious.

    Therefore, use the benchmarks in this guide to calibrate your expectations. Then build a competitor monitoring practice that turns benchmark data into actual strategy.

  • How to Detect Fake Followers (And Why It Changes Your Strategy)

    How to Detect Fake Followers (And Why It Changes Your Strategy)

    How to detect fake followers on social media — 37% average fake followers per influencer account

    A competitor just hit 200,000 followers on Instagram. Should you be worried?

    Maybe. However, before you rethink your entire content strategy based on someone else’s follower count, it’s worth asking a more useful question: how many of those 200,000 followers are real?

    In fact, fake followers are more common than most social media managers realize. They inflate vanity metrics, distort competitive benchmarks, and — if they’re on your own account — actively hurt your reach. This guide covers how to detect fake followers on any account, what signals to look for, and how this data should change the way you analyze competitors and evaluate influencer partnerships.

    Industry data:  Research estimates that the average influencer account carries around 37% fake or inactive followers. On Instagram, roughly 10% of all accounts are estimated to be bots or spam. Fake followers above 25% on any account is generally considered a red flag.

    What Are Fake Followers, Exactly?

    Not all fake followers are the same. Therefore, it helps to understand the different types:

    Bot accounts are automated accounts created at scale. They follow, like, and sometimes comment using scripted behavior. They have no real person behind them.

    Purchased followers are bought in bulk through third-party services. They may be bots, inactive accounts, or real people from completely irrelevant geographies paid to follow an account.

    Inactive followers are real people who created accounts but stopped using the platform. They were never fake — they just stopped engaging. Every account accumulates these over time.

    Engagement pod followers are real accounts that participate in coordinated groups where members agree to like and comment on each other’s content. This inflates engagement metrics without representing genuine audience interest.

    Consequently, the distinction matters because inactive followers are a natural part of any account — while purchased followers and bots are a deliberate strategy to inflate numbers. In a competitor analysis, you’re primarily looking for the latter.

    Why Fake Followers Matter for Your Strategy

    The obvious answer is that fake followers distort engagement rates. However, the strategic implications go further.

    It changes how you interpret competitor growth

    For example, if a competitor gained 50,000 followers last quarter, the natural reaction is to worry. about what they’re doing differently. But if 30,000 of those followers were purchased, the real story is that their organic growth was modest — maybe even weaker than yours.

    Benchmarking your performance against inflated numbers leads to bad decisions: unnecessary strategy pivots, budget shifts, or confidence problems that aren’t grounded in reality.

    It affects influencer partnership decisions

    An influencer with 100,000 followers and 30% fake followers has roughly 70,000 real followers. If you’re paying based on their total follower count, you’re overpaying by 30%. At scale — across multiple influencer campaigns — this becomes a significant budget problem.

    Fake followers on your own account hurt your reach

    Furthermore, this is the part most people miss. Instagram, TikTok, and other platforms use engagement rate to determine how widely to distribute your content. If a large percentage of your followers are inactive or fake, your engagement rate drops — and the algorithm shows your content to fewer real people.

    A smaller, genuinely engaged audience consistently outperforms a large, inflated one in terms of actual reach and conversion.

    Key insight:  Fake followers don’t just make numbers look bad — they actively suppress your content distribution on algorithmic platforms like Instagram and TikTok.
    7 signals that indicate fake followers — low engagement, follower spikes, bot profiles, geographic mismatch

    Signals That Indicate Fake Followers

    You don’t always need a tool to spot a heavily inflated account. These signals are visible on any public profile:

    SignalWhat it looks likeReliability
    Engagement rate vs follower count500K followers but only 300 likes per postHigh
    Follower growth spikeGained 40K followers in 3 days, then flatlinedHigh
    Follower profile qualityNo profile photo, zero posts, following 5,000+ accountsHigh
    Comment qualityGeneric praise: ‘Great post!’ ‘Love this!’ in every commentMedium
    Following-to-follower ratioFollows 8,000, has 9,000 followers — suspicious symmetryMedium
    Geographic mismatchBrand targeting US, but 70% of followers from Southeast AsiaHigh
    Engagement podsSame 30 accounts comment on every single post within minutesMedium

    Nevertheless, no single signal is definitive on its own. An account can have a genuine follower spike from going viral. Generic comments might just reflect a passive audience. Look for multiple signals appearing together — that’s when it becomes meaningful.

    How to Check for Fake Followers

    There are two approaches: manual inspection and automated tools. Both have a role.

    Manual inspection

    For a quick sense check on any account:

    1. Check engagement rate. Divide average likes + comments per post by total followers. Multiply by 100. For most accounts, 1–5% is normal on Instagram. Significantly below 1% on a large account is a red flag.
    2. Look at the follower growth chart. Most analytics tools (including Metriwo) show follower growth over time. A sudden spike followed by a plateau usually indicates purchased followers.
    3. Browse followers manually. Click through 20–30 followers at random. Look for: no profile photo, no posts, following thousands of accounts, generic usernames with random numbers. If more than a quarter look like this, the account has a real fake follower problem.
    4. Read the comments. Genuine engagement includes specific references to the post content. Fake engagement is vague: ‘Nice!’, ‘Love this’, single emojis, or completely off-topic remarks.

    Manual inspection works for a spot check. However, it doesn’t scale if you’re monitoring multiple competitors or evaluating dozens of influencers.

    Using a fake follower detection tool

    A dedicated tool automates the analysis and gives you a percentage score rather than a gut feeling. What to look for in a tool:

    • Analyzes the full follower base, not just a sample
    • Provides a clear fake follower percentage, not just flags
    • Works on any public account — not just your own
    • Shows follower growth trends over time so you can spot purchase events
    • Covers multiple platforms, not just Instagram

    Metriwo’s fake follower detection checks any public Instagram, Facebook, X, LinkedIn, or TikTok account — no login required for competitor pages. The result is a clear percentage score alongside follower growth history and engagement data, so you can see the full picture in one place.

    How to Use Fake Follower Data in Practice

    Knowing that an account has fake followers is only useful if you act on it. Here’s how this data applies to the most common scenarios:

    Use caseWhat fake follower data tells youAction to take
    Competitor has 200K followers but weak engagementFollower base may be partially inflated — their real reach is smaller than it looksDon’t benchmark your own growth against their vanity numbers
    Potential influencer partner has 80K followersWhether those followers are real, active, and in the right geographyNegotiate price based on real audience, not total follower count
    Your own account’s engagement droppedWhether a follow-for-follow campaign or aggressive following attracted low-quality followersAudit and remove fake followers to restore engagement rate
    New competitor appeared and grew fastWhether their growth is organic or purchasedIf inflated, don’t panic — their audience isn’t real traction

    What to Do If Your Own Account Has Fake Followers

    First of all, don’t panic. Every account accumulates some fake and inactive followers over time. The question is whether the percentage is high enough to be hurting your reach.

    If your fake follower rate is above 15–20%, it’s worth taking action:

    • Audit your follower acquisition history. Did you run a follow-for-follow campaign? A giveaway that attracted low-quality accounts? Paid promotion in the wrong geography? Identifying the source helps you avoid it in future.
    • Remove fake followers on Instagram. Instagram allows you to remove followers from your account without blocking them. Go to your followers list, tap the three dots next to a suspicious account, and select Remove Follower.
    • Stop tactics that attract fake followers. Follow-for-follow, buying followers, and some giveaway formats consistently attract low-quality accounts. The short-term follower boost isn’t worth the long-term engagement penalty.
    • Monitor monthly going forward. A tool like Metriwo tracks your fake follower percentage over time, so you can catch problems before they compound.
    Worth knowing:  Removing fake followers typically improves your engagement rate immediately — because the same real engagement is now divided by a smaller, more accurate follower count. A smaller number that’s real is better than a large number that’s padded.

    Frequently Asked Questions

    Can I check fake followers on a competitor’s account?

    Yes, for any public account. You don’t need their login or permission. Tools like Metriwo analyze any public Instagram, Facebook, X, LinkedIn, or TikTok page and return a fake follower percentage alongside growth trends and engagement data.

    What percentage of fake followers is normal?

    Most accounts accumulate 5–15% fake or inactive followers naturally over time. Above 20% starts to noticeably affect engagement rate. Above 30% is a significant problem — either from purchased followers or aggressive low-quality growth tactics. Celebrities and very large accounts often have higher percentages due to bot activity targeting popular profiles.

    Do fake followers hurt your Instagram reach?

    Yes. Instagram’s algorithm uses engagement rate to decide how widely to distribute your content. Fake and inactive followers drag down your engagement rate — because they never like, comment, or watch — which tells the algorithm your content isn’t worth showing to more people.

    How do engagement pods differ from fake followers?

    Engagement pods are groups of real users who agree to like and comment on each other’s content. Unlike bots, they’re real people — but the engagement isn’t genuine. It inflates metrics without reflecting real audience interest, which makes it misleading for brands evaluating influencers.

    Is it possible to remove fake followers from Instagram?

    Yes. Instagram lets you remove individual followers without blocking them. For large-scale removal, third-party tools can help identify and batch-remove suspicious accounts. Instagram also periodically purges bot accounts automatically, which can cause sudden drops in follower count on heavily inflated accounts.

    The Bottom Line

    Follower counts are the most visible metric on social media — and the most easily manipulated. A competitor with 300,000 followers and 25% fake followers has a real audience of around 225,000. A competitor with 80,000 followers and 5% fake followers has a more genuine audience of 76,000.

    The second account probably has better engagement, better reach, and more actual influence. But without fake follower detection, you’d likely be more impressed by the first.

    Real competitive intelligence means looking past the numbers on the surface. Fake follower analysis is one of the fastest ways to separate genuine growth from inflated vanity metrics — and it changes the way you benchmark your competitors, evaluate partnerships, and grow your own presence.

    Check any account — yours or a competitor’s. Metriwo’s fake follower detection runs on any public Instagram, Facebook, X, LinkedIn, or TikTok account. No login required for competitor pages. See the real numbers behind any follower count. metriwo.com  →
  • Social Media Competitor Analysis: A Step-by-Step Guide (2026)

    Social Media Competitor Analysis: A Step-by-Step Guide (2026)

    Social media competitor analysis guide 2026 — track engagement rate, follower growth, and content strategy

    In fact, you don’t need to guess what’s working in your industry. Your competitors are already publishing that data publicly — their follower counts, engagement rates, top posts, posting frequency, and content strategy are all visible to anyone who knows where to look.

    This guide walks you through exactly how to do a social media competitor analysis: what to look for, which metrics actually matter, how often to do it, and how to turn the data into decisions.

    What Is a Social Media Competitor Analysis?

    A social media competitor analysis is the process of systematically reviewing your competitors’ social media presence to understand their strategy, benchmark your own performance, and find opportunities they’re missing.

    When done right, it answers questions like:

    •        Why is that account growing faster than ours?

    •        What content formats are driving the most engagement in our industry?

    •        Which platforms are our competitors ignoring — and should we be there instead?

    •        Are their 200,000 followers real, or inflated with fake accounts?

    Most teams do this manually, once a quarter, using spreadsheets. That’s better than nothing. However, it only gives you a snapshot — but the brands that win on social are the ones monitoring competitor data continuously, not just taking a quarterly snapshot.

    Key insight: Competitor strategies shift fast. A post format that got 2% engagement in January might be hitting 8% by March. Daily monitoring catches these shifts early. Quarterly analysis misses them entirely.
    5 steps to analyze competitors on social media — identify, track metrics, collect data, find gaps, take action

    Step 1 — Identify the Right Competitors to Track

    Most teams make the mistake of tracking too many competitors, or tracking the wrong ones. Here’s how to build a useful competitor list:

    Direct competitors sell the same product or service to the same audience. These are your primary benchmark. Aim for 3–5.

    Indirect competitors solve the same problem differently. Worth watching for content angles and audience overlap.

    Aspirational accounts aren’t competitors but have mastered the content or audience you want. Good for creative benchmarking.

    Practical tip: Don’t track more than 7–8 competitors total. More than that and the data becomes noise. Pick the ones your audience is most likely to follow alongside you.

    Step 2 — Decide Which Metrics to Track

    Not all metrics are equally useful. Here’s what actually matters in a competitor analysis — and what each metric tells you:

    MetricWhat it tells youHow often to check
    Follower growth rateIs their audience growing, shrinking, or stagnant?Weekly
    Engagement rateDoes their audience actually care about their content?Weekly
    Posting frequencyHow active are they — daily, 3x/week, sporadic?Weekly
    Top-performing contentWhat formats and topics get the most response?Monthly
    Platform focusWhere are they investing their effort?Monthly
    Follower overlapHow much of your audience also follows them?Monthly
    Fake follower %Is their large following real or inflated?Once/quarter

    Two metrics in this list deserve extra attention:

    Engagement rate is more important than follower count. A competitor with 50,000 followers and 0.5% engagement is less of a threat than one with 10,000 followers and 4% engagement. The second audience is actually paying attention.

    Fake follower percentage is underused. If a competitor’s follower count looks impressive but 30–40% are fake or inactive accounts, their reach is much smaller than it appears. This is a real competitive insight — and one that’s hard to spot without a dedicated tool.

    Step 3 — Gather the Data

    There are two ways to collect competitor data: manually, or with a monitoring tool.

    Manual approach

    Visit each competitor’s profile directly. Screenshot their bio, follower count, and recent posts. Record engagement on their last 10–20 posts. Track posting frequency by counting posts per week.

    Honest assessment: this works for a one-off analysis. It doesn’t scale, it’s slow, and it only gives you a snapshot — not a trend line. If a competitor grew 8% last month but you only check quarterly, you miss that entirely.

    With a competitor monitoring tool

    As a result, a tool like Metriwo connects directly to public social pages and collects data daily — automatically. You get follower growth trends over time, engagement rate history, top-performing content by format, posting frequency patterns, and follower overlap between your audience and theirs.

    The difference isn’t just convenience. Daily data reveals patterns that quarterly snapshots hide — like a competitor testing a new content format, doubling down on Reels, or suddenly going quiet.

    Metriwo note: Metriwo monitors any public Instagram, Facebook, X, LinkedIn, or TikTok page without needing access to that account. Data is collected daily. Coconut, Metriwo’s AI assistant, highlights the most significant changes automatically.

    Step 4 — Analyze What You Find

    Raw numbers aren’t useful on their own. Therefore, the goal is to identify patterns and turn them into decisions. Here’s how to structure your analysis:

    Content performance patterns

    Look at which post formats — Reels, carousels, static images, Stories, text posts — generate the highest engagement for each competitor. If three of your five competitors are getting 3x more engagement on short-form video than on static images, that’s a signal about what your shared audience responds to.

    Posting frequency and timing

    Additionally, note how often competitors post and when. A competitor posting daily at 7am and consistently getting strong early engagement has likely tested this timing. You don’t need to copy it — but you should test whether it works for your audience too.

    Content themes and gaps

    What topics are competitors covering heavily? Furthermore, what are they ignoring? If five competitors all post about scheduling tips but none are covering competitor strategy or analytics, that’s a content gap you can own.

    Audience quality check

    A competitor with rapid follower growth is only worth worrying about if that growth is real. Use fake follower detection to check whether their numbers reflect genuine audience interest or inflated vanity metrics.

    Step 5 — Turn Insights Into Action

    A competitor analysis that doesn’t change your strategy is wasted effort. Here’s how to close the loop:

    1.     Benchmark your own metrics. Once you have competitor data, consequently, compare it to your own. Where are you ahead? Where are you behind? Be honest.

    2.     Identify one content format to test. If competitors are consistently outperforming you on a specific format, run a 30-day test with that format on your own channels.

    3.     Find two topics to own. Look for subjects that are underserved in your competitor content but relevant to your audience. Build a content series around them.

    4.     Set a monitoring cadence. In particular, commit to reviewing competitor data weekly (key metrics), monthly (content trends), and quarterly (full strategic review). Daily monitoring via a tool makes the weekly and monthly reviews much faster.

    5.     Share findings with your team. Competitor insights shouldn’t live in one person’s spreadsheet. A short monthly summary keeps everyone aligned on what’s changing in the market.

    How Often Should You Run a Competitor Analysis?

    Ultimately, the more often you monitor, the better— but the cadence that’s actually sustainable depends on your team size.

    •        Weekly: Review key metrics (follower growth, engagement). Best done with a monitoring tool that surfaces changes automatically.

    •        Monthly: Review top-performing content, content format trends, and new platform activity.

    •        Quarterly: Full strategic review. Update your competitor list. Run a SWOT comparison. Adjust your own content strategy based on what you’ve learned.

    Most teams can’t sustain weekly manual reviews. The solution is automation — set up a tool that collects data daily and alerts you to significant changes, so your weekly review takes 10 minutes instead of two hours.

    Stop doing this manually.Metriwo monitors any public social page daily and tracks all the metrics above automatically. Coconut, Metriwo’s AI assistant, surfaces the insights that actually matter — so you spend time acting on data, not collecting it.metriwo.com  →

    Frequently Asked Questions

    How do I analyze a competitor’s social media without their login?

    Any public social media page is visible without login — you just need the right tool to collect and organize the data. Metriwo monitors any public Instagram, Facebook, X, LinkedIn, or TikTok page daily without requiring access to that account.

    What metrics matter most in a social media competitor analysis?

    Engagement rate and follower growth rate are the most important. Engagement rate tells you whether an audience is active, not just large. Growth rate tells you whether a competitor’s strategy is working right now. Posting frequency, content format breakdown, and fake follower percentage round out a solid analysis.

    How many competitors should I track?

    3–5 direct competitors is the right range for most teams. Add 1–2 indirect competitors or aspirational accounts if useful. More than 7–8 total creates analysis paralysis without adding much value.

    How is follower overlap useful in a competitor analysis?

    Follower overlap shows how much of your competitor’s audience also follows you — and vice versa. High overlap means you’re competing directly for the same attention. Low overlap might reveal untapped audience segments your competitor has reached that you haven’t.

    What’s the difference between social listening and competitor analysis?

    Social listening tracks mentions, conversations, and sentiment about your brand and industry across the web. Competitor analysis focuses specifically on evaluating your competitors’ social media performance and strategy. Both are valuable — competitor analysis gives you benchmarks, social listening gives you context.

    The Bottom Line

    A social media competitor analysis isn’t a one-time project. It’s an ongoing intelligence system. The teams that win on social aren’t guessing — they’re watching what works in their market, finding the gaps, and moving faster than competitors to fill them.

    The difference between a quarterly snapshot and daily monitoring isn’t just speed. It’s the ability to catch a competitor’s strategy shift before it becomes a trend — and get ahead of it instead of reacting to it.

  • Best Hootsuite Alternative in 2026

    Best Hootsuite Alternative in 2026

    Best Hootsuite alternative in 2026 — Metriwo vs Hootsuite feature comparison
    Metriwo offers competitor monitoring, AI assistant, and a free plan — features Hootsuite doesn’t include.

    Hootsuite was the default choice for social media management for a long time. However, in 2023, it killed its free plan. Then its pricing climbed to $99/month for a single user. Now, thousands of social media managers, agencies, and small businesses are looking for a better option.

    This guide covers the best Hootsuite alternatives in 2026 — what each one does well, where it falls short, and who it’s actually built for. No sponsored rankings.

    Why People Leave Hootsuite

    Before comparing alternatives, it helps to understand the most common complaints. Specifically, users cite these recurring issues:

    • Price: Hootsuite’s Professional plan starts at $99/month. For agencies or teams, costs escalate fast.
    • No free plan: Hootsuite removed its free tier in 2023. You either pay or you don’t use it.
    • Cluttered interface: Long-time users describe the dashboard as bloated — too many tabs, too many clicks.
    • Weak competitor analytics: Hootsuite’s built-in competitor tracking is limited compared to dedicated analytics tools.
    • Limited AI features: The platform hasn’t kept pace with AI-native tools that emerged in 2024 and 2025.

    If any of these hit close to home, the alternatives below are worth a serious look.

    The Best Hootsuite Alternatives in 2026

    1. Metriwo — Best for Analytics + Publishing in One Place

    Best for: Social media managers, agencies, and SMBs who need scheduling, competitor monitoring, and AI insights without paying enterprise prices.

    Metriwo is an all-in-one social media platform that combines what most tools split across two or three subscriptions: content scheduling, deep analytics, competitor monitoring, and a unified inbox.

    The standout feature is competitor analytics. With Metriwo, you can analyze any public social media page — Instagram, Facebook, X, LinkedIn, or TikTok — without needing access to that account. Metriwo collects data daily, so you’re always working with current numbers.

    It also ships with Coconut, a built-in AI assistant that suggests content ideas, surfaces competitor insights, and recommends actions based on your account performance. This isn’t a chatbot bolted on as an afterthought — it’s integrated into the core workflow.

    Key features:

    • Schedule and publish to Instagram, Facebook, X, LinkedIn, and TikTok
    • Analyze any public social page — competitor monitoring with daily data
    • Unified inbox for all direct messages across platforms
    • Fake follower detection and follower overlap analysis
    • Coconut AI assistant built into the dashboard
    • Free plan + PRO and Agency paid tiers

    Vs Hootsuite: Hootsuite charges $99/month and still doesn’t include real competitor monitoring. Metriwo starts with a free plan and includes competitor analytics by default — not as an add-on.

    2. Buffer — Best for Simple Scheduling on a Budget

    Best for: Solo creators, freelancers, and small businesses who primarily need scheduling.

    Buffer strips social media management down to its core: write a post, schedule it, publish it. The interface is clean and fast. Furthermore, their free plan is one of the most generous in the space.

    Strengths: Very affordable (paid plans from $6/channel/month), easy to use, solid queue-based scheduling.

    Limitations: Analytics are basic on lower tiers. No competitor monitoring. No unified inbox. Not designed for agencies managing multiple clients.

    Bottom line: Great if publishing is your only need. If you want analytics or competitor data, you’ll need a separate tool.

    3. Later — Best for Visual Scheduling and Instagram-First Teams

    Best for: Brands and creators with heavy Instagram and TikTok focus.

    Later’s visual content calendar is genuinely excellent — you can drag and drop media directly into your calendar and , as a result, preview how your feed will look before publishing.

    Strengths: Beautiful visual planner, strong Instagram/TikTok features, good for visual brands.

    Limitations: Analytics are limited outside Instagram. No real competitor monitoring. Not ideal for agencies managing diverse client portfolios.

    Bottom line: The best option if your entire strategy revolves around Instagram. Less useful if you need cross-platform depth.

    4. Sprout Social — Best for Large Teams with Premium Budgets

    Best for: Enterprise teams and larger agencies with $250+/month to spend.

    Sprout Social is the most feature-complete tool in this list — robust analytics, social listening, CRM integrations, and excellent team collaboration. In addition, it offers some of the best reporting in the industry.

    Strengths: Best-in-class analytics and reporting, strong social listening, polished enterprise workflows.

    Limitations: Starts at $249/month. Overkill for teams under 5 people or budgets under $200/month.

    Bottom line: Worth every cent if your team is 10+ people and you’re reporting to stakeholders who need hard data. Too expensive for most small businesses.

    5. Agorapulse — Best for Agency Inbox Management

    Best for: Agencies that handle high volumes of comments, DMs, and mentions across multiple client accounts.

    When it comes to inbox management, Agorapulse is genuinely excellent. Every comment, DM, and mention flows into one place. Moreover, assignment and labeling features make team triage significantly faster.

    Strengths: Best unified inbox in the space, solid reporting, good for agency workflows.

    Limitations: More expensive than Buffer or Later. Analytics aren’t as deep as Metriwo’s competitor monitoring features.

    Bottom line: If inbox management is your biggest pain point, Agorapulse is the strongest choice. If competitor analytics matter, look at Metriwo.

    6. SocialBee — Best for Content Recycling

    Best for: Businesses that want to build an evergreen content library and recycle top posts automatically.

    SocialBee organizes your content into categories (educational, promotional, curated, etc.) and, consequently, rotates them on a schedule that keeps your feed consistently active.

    Bottom line: Excellent for content consistency. Not the right fit if analytics or competitor data are priorities.

    Side-by-Side Comparison

    FeatureMetriwoHootsuiteBufferLaterSprout Social
    Free plan✓ Yes✗ No✓ Yes✓ Limited✗ No
    Starting priceLow$99/mo$6/ch$18/mo$249/mo
    Platforms535+669
    Competitor monitoring✓ Deep (daily)⚠ Basic✗ No✗ No⚠ Limited
    AI assistant✓ Coconut⚠ Basic✗ No✗ No⚠ Limited
    Unified inbox✓ Yes✓ Yes✗ No✗ No✓ Yes
    Fake follower detection✓ Yes✗ No✗ No✗ No✗ No
    Analyze public pages✓ No login needed✗ No✗ No✗ No✗ No

    How to Choose the Right Hootsuite Alternati

    Ultimately, the right tool depends on what’s actually broken in your current workflow:

    • Hootsuite is too expensive: Start with Buffer (simplest) or Metriwo (more features, still affordable).
    • You need competitor analytics: Metriwo is the best choice — daily data on any public page, no credentials required.
    • You manage client accounts: Metriwo or Agorapulse, depending on whether analytics or inbox management matters more.
    • You’re Instagram-first: Later has the best visual planning experience.
    • You want enterprise-grade everything: Sprout Social, if you can justify the price.

    Frequently Asked Questions

    Is there a free Hootsuite alternative?

    Yes. Both Buffer and Metriwo offer free plans. Buffer’s free plan is limited to 3 channels and 10 scheduled posts. Metriwo’s free plan includes analytics and scheduling across platforms.

    What is the cheapest Hootsuite alternative?

    Buffer starts at $6 per channel per month. Metriwo’s paid plans are also significantly cheaper than Hootsuite while offering more features — including competitor monitoring and AI.

    Which Hootsuite alternative is best for agencies?

    For inbox management and client workflows, Agorapulse is strong. For competitor analytics and all-in-one functionality at a lower price, Metriwo is the better fit for most agencies.

    Can I analyze competitors without a Hootsuite plan?

    Yes. Metriwo lets you analyze any public social media page — Instagram, Facebook, X, LinkedIn, TikTok — without needing access to that account. Data is collected daily.

    Does Metriwo have an AI assistant?

    Yes. Metriwo includes Coconut, a built-in AI assistant that suggests content, surfaces competitor insights, and provides recommendations based on your account data.

    The Bottom Line

    Hootsuite built the category. Nevertheless, it hasn’t kept up with what modern social media teams actually need: affordable pricing, real competitor intelligence, and AI built into the workflow.

    If you’re looking for a Hootsuite alternative that covers scheduling, analytics, competitor monitoring, and AI in one place — without paying $99/month — Metriwo is the strongest option on this list.

    Try Metriwo free — no credit card required Schedule, analyze, monitor competitors, and let Coconut AI do the heavy lifting — all from one dashboard. metriwo.com  →